
With a survey you can get insights in the data or the situation of a prospect, check in on expectations before launching a new product or find out the satisfaction level of your customers and colleagues.
In this article we will show you step by step how you can create a survey that can lead to this result:

1. Collect data with the different survey elements
Combine relevant survey elements to ask all of your questions and collect the needed data.
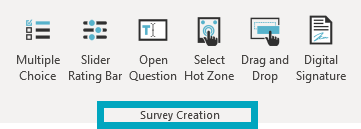
You can create a
- multiple choice question
- slider rating bar (and even combine it with images)
- open question
- hot zone
- drag and drop
- signature field
In our example we only used open questions.
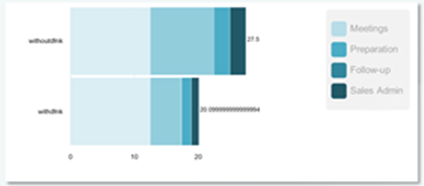
2. Illustrate the results
You can work with a graph or make some calculations to illustrate the results of the entered data.
In our example we have worked with a vertical bar graph:
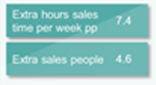
And we did some calculations:
3. Add a submit button
When hitting the submit button all the collected data will be saved in an online database.
By making the button transparant, you can put it on top of any shape you want to match your design.

We also want to send this result to our (potential) customer so that they have the outcome of our meeting as well - which you can define in the settings of the submit-button, together with all details of the message sent.
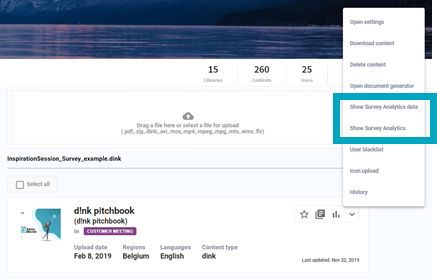
4. Consult the collected data
Go to your publication in the Portfolio Manager and click on ‘Show Survey Analytics data’ to download a .xlsx file with all collected data or choose ‘Show Survey Analytics’ to show graphs of it.
5. Example
You can download the PowerPoint of this survey example right here.
Comments